A vibrant and active community isn't every business owner's dream?
It is always full of life, people are discussing, asking or even arguing about something. Of course, under the watchful supervision of the community or admin. These are already loyal users (perhaps even brand advocates) or newcomers who are keenly interested in the services of the community.
1. How to calculate the most active 1.1. Activity indicators 2. Parsing algorithm 2.1. How to determine who was interested in community products 2.2. Parsing results
Why do you need to track activity?
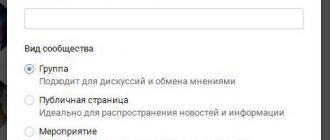
First, let's define what the concept of “Activity in VK groups” means. This includes the following:
- Likes;
- Reposts;
- Comments;
- Views;
- Visits;
- Messages;
- Subscribe to notifications;
- Unsubscribe from news;
- Joining/leaving a group;
- Adding photo/video/audio files;
- Create a discussion topic.
Some of the items depend on the personal settings of each community. For example, discussions or messages are not included everywhere, subscribers can not add photos, videos, discussion topics, etc. And accordingly, these indicators will not be displayed in statistics.
Community Analysis
After installing filters in the right sidebar of the allsocial.ru website, only those that meet the specified criteria will be shown in the feed. By clicking on the “+” icon, you can add groups to Favorites for further analysis (the option is available after authorization).
The top menu of the service contains the main indicators for analytics. Let's look at each of them in more detail:
- Subscribers - this column indicates the number of subscribers at the end of the marked period.
- Coverage - data from open VKontakte statistics is loaded into this construction site. The number shows the number of views for the specified period.
- Visitors - statistics from VKontakte are also loaded into this line. The number in this line shows the number of visitors for the specified period.
- Growth – this parameter allows you to sort by growth over the period in %. The indicator is calculated as a percentage relative to the total number of subscribers.
- CPP (cost per rating point) - shows the cost of informing 1% of the audience. This parameter can be indirectly used to assess the effectiveness of an advertising campaign.
Purposes of monitoring group activity – why study?
First of all, it is necessary to track activity in order to understand which audience is most involved in the life of the community (age, gender, geography, etc.). Having this information helps improve the quality of further attracting people. That is, you, as a manager, when setting up a target for your advertising, know by what criteria to look for your target audience.
Secondly, it gives an understanding of which posts get the most impact. This is no less important information. It makes it possible to improve the quality of published content and know in which direction to develop further.
For example, you decided to experiment and publish mostly entertainment content for a week. You wanted to understand how your audience would react to this. After a week (or maybe earlier), you look at the activity statistics and, based on the results, draw appropriate conclusions and take further measures.
How to view VKontakte group statistics
There is a direct way: go to any group and click on the ellipses icon “…” at the top of the page on the right. In the drop-down menu that opens, select “Statistics”.
If it is open, you will go to the section with charts. If access is closed, then you will not be able to open it yourself, but you can still look at the statistics of such communities. More on this a little later, but now let’s look at what to look for when assessing the quality of a public page in accordance with your goals.
1 On the first tab “Attendance” you will see the daily number of visitors, as well as their characteristics. In the first graph, you can estimate how many unique visitors and views the page has daily or monthly. Always compare this parameter with the number of subscribers: for example, if there are 100k+ subscribers in a group, but in reality a couple of dozen people visit the group a day, we can say that the public has died or been scammed by bots.
2 Next come the gender and age characteristics of the target audience. Here, look at which people you need to sell the product to. If it is female, then a solvent female audience is needed. So, if you are selling something to young mothers, and the majority of the public audience are women over 40, then it is not suitable for you.
3 Geography. If you advertise an offer on a CPA network, pay attention to what geo it accepts. Choose public pages with the vast majority of subscribers from the geolocation specified for your offer.
4 Devices. Where do the most visits come from: PC or mobile? Does the product you are advertising have a mobile landing page or a page with responsive design? Always pay attention to this, otherwise you may be left without conversions and a hole in your advertising budget.
5 Referral sources. You can see where people access the public page from. As a rule, people go to public pages that interest them from “My Groups”. The higher the percentage of such visits, the better.
6 Participants. When the number of entrants is greater than those exited, this is an excellent indicator. Sharp jumps in exiting participants mean that the group is being cleared of bots either by the public admins or the VKontakte administration due to suspicions of cheating.
7 “Coverage” tab. It also shows the character of the public’s audience, only from a different perspective. Reach is a parameter that indicates the number of views of posts during a day or month on a wall or in “News”. It is even more important than traffic, since most subscribers will see your advertisement not when visiting the group, but in their news feed or on the wall of users who repost. Pay attention to the characteristics of your target audience: gender, age, location, device.
8 “Activity” tab. She talks about how active life is in the community. Here you can see how willingly people react to posts with likes, comments and reposts, and also see how many subscribers unsubscribe from news.
Bottom line
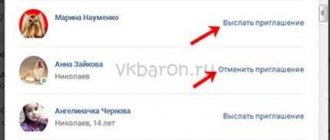
So, we talked about how to track this or that activity in the VKontakte group. Now you know how and why this is done, and you also learned about a new application that helps you get more detailed information about members who have joined or left.
All that is required of you is to use the acquired knowledge in practice. We hope our article was useful to you.
Rate the text:
[Total: 11 Average: 4.5/5]
Author of the publication
offline 7 years
softmarker
Comments: 95Publications: 268Registration: 05/15/2014
Search by administrators
In the “Administrators” section you can get information about the people who administer communities. Using the search bar, you can find a person by last name and first name. Allsocial analytics allows you to sort by the number of publics, number of subscribers, coverage and period. You can choose the period: day, week or month. By clicking on the administrator's name, you will automatically be taken to his VKontakte profile. Where you can write a message and agree to exchange posts or place advertisements.
TrendHERO (TrendHiro)
The service finds and checks Instagram accounts for cheating.
TrendHiro is convenient and simple, while it deeply analyzes the audience. To work with it, you do not need to connect your account, but you will have to register.
TrendHiro Statistics
As a result of the analysis, you will receive the following information:
1. Description of the account, the total number of subscribers and their growth graph, the size of the quality audience, the percentage of involvement, the average number of likes and comments per post.
2. The percentage of the audience that has less than 1500 subscriptions, the authenticity of the audience. 3. Geographical location by city and country of the entire audience and like subscribers. 4. Gender of the audience and likes of subscribers as a percentage. 5. Types of audience and their interests in percentage terms.
6. A graph of the growth of subscribers and subscriptions helps to identify the use of “gray” methods to attract an audience. 7. Post distribution chart and percentage of likes from subscribers. 8. Comments by type: real, short, suspicious, left by the author. 9. Percentage of likes and comments with a certain number of subscriptions and subscribers. 10. Number of comments for every 100 likes. 11. List of top hashtags. 12. A selection of top mentions of other accounts. 13. A selection of publications with the largest number of likes and comments.
An interesting nuance: it will not be possible to quickly obtain information, because generating a report can take 12 hours or more. This is due to the fact that information is also collected about the profiles of subscribers of the analyzed blogger.
TrendHiro service tariffs
Free trial period - 3 account checks.
If you need more checks, you can choose packages of different sizes and prices. Currently (mid-April 2021) there is a promotion - 50% discount on all packages.
Currently, the smallest package of 10 checks costs $7.99, and the largest of 200 checks costs $79.99
TrendHiro does a very detailed analysis of your account and helps you choose the right platform for advertising. This is one of the few services that shows the percentage of real and suspicious subscribers. And besides this, it provides analytics based on more than 10 criteria.
More useful metrics for analytics on VKontakte
New metrics can be gradually added (and not all are added in the article), and you will be able to analyze the statistics of VKontakte communities in even more detail. Whether it's analyzing someone else's page or group.
Er day/post indicator (engagement) and a summary table of the main group indicators.
This article may also be useful:
How to find viral VKontakte posts on any page in a couple of clicks.
FeedSpy
The service is designed to monitor and analyze the content of your own accounts on social networks and competitors’ pages. FeedSpy works with:
What statistics are there in FeedSpy?
A simple service that, based on the name of your Instagram account or page URL, will give you a list of posts for the selected period.
Publications can be sorted by:
1) exit time; 2) the number of likes; 3) the number of comments; 4) the engagement rate of the publication; 5) engagement rate by views.
You can immediately look at the content of the selected posts and understand which topics have a viral effect.
In addition, the service shows the dynamics of likes and comments. Audience activity chart by hours and days of the week.
Interesting nuances: in the test format, information on an Instagram account can be obtained without registration; for all other social networks, authorization is required. FeedSpy, like Popsters, allows you to receive information on only one social network on one tariff.
FeedSpy service tariffs
Free trial period - 5 downloads of analytics for 1 social network, search for viral posts.
Then you can choose a tariff for one social network for any period, ranging from one month to a year. In this case, the cost when paying for 1-2 months will be 299 monthly. And when paying for 1 year - 209 rubles per month for 1 social network, which is almost 30% cheaper.
The FeedSpy service is simple and straightforward. Allows you to analyze the content of an unlimited number of accounts, select the best time to publish, find and analyze viral posts.